
Example
The following example is completely fictitious and is simply presented to illustrate how ASTERIG© could be used to assess the risk potential of a gambling product. Assume that there is a game, which we will call bet-for-soccer from the also fictitious provider bets-limited.
In our example, bet-for-soccer has the following attributes:
-
-
-
-
-
-
-
-
-
In this fictitious national league there are 24 teams that play in 12 matches in different cities on each Saturday. -
Betting on all games is allowed. -
For each match, it is allowed to bet that: (a) team A will win, (b) team B will win (c) there will be a tie. It is possible to bet all three outcomes at the same time. -
In theory the probability of each outcome is 1/3 = 0.33 = 33.33%. But in sports-betting there are always quotes which depend on the voting of all the players (gamblers) who bet on that particular game. For example. 50% of all gamblers could bet for (a) that team A wins, 25% for (b), that team B wins, and 25% for (c), there is a tie. The quotes could theoretically range between 0% and 100%, e.g. when all gamblers would bet for (a) the advantage of team A and nobody for the alternatives (b) and (c). -
The chance of winning a profit and the amount of a possible profit depend on the quotes. If e.g. 50% of all players bet that (a) team A wins, 25% that (b) team B wins and 25% that (c) there is a tie, the quotes would be distributed - after a 10% margin for the provider - as follows: 1.8 if team A wins, 3.6 if team B wins and 3.6 there is a tie. The profits would also be distributed in the equivalent relations. If team A wins those players (gamblers) who bet on this result will get $1.8 for each $ they bet. If the other two alternatives are realized, those gamblers would get $3.6 for each $ bet. -
The minimum stake is $1. The maximum allowed stake is $100 per each match. So the maximum win would be $100 x 90 (100% quote minus 10% margin for the provider) = $9.000 for each match. If the gambler bets on each of the 12 games, the maximum stake by this individual could be a total of $1.200 per week. The maximum win could be $9.000 x 12 matches = $108.000 per week. -
There is no jackpot. -
On the webpage of the provider only visual effects exist. There are no auditory effects. Also all other marketing activities use only visual activities.
-
-
-
-
-
-
-
-
Based on the description of the fictitious game bet-for soccer determines the following scores would be assigned:
1. Event frequency
Unit of time between stake, gambling result and next stake opportunity: > 6 days, because the matches run only every Saturday. Even considering that it is possible to bet on all 12 matches every week, it should be assumed that all 12 stakes would be done once a week in less than one day.
Score: 0
2. Interval of payback
Period of time between gambling result and notification of payment or actual receipt of payment: ≤ 5 sec, because the bets are run online and the gambling result and notification of payment is given just in time after the soccer match finishes.
Score: 10
3. Jackpot
An extraordinary top prize typically in the form of a large amount of money formed by the accumulation of previous bets: There is no jackpot.
Score: 0
4. Continuity of playing
There are maximum 12 possibilities (= matches) per week, per gambling without an interruption. If we assume that all 12 possibilities are used and that all betting is done in one term (without any interruption) and one betting takes in average approximately 5 minutes for each match, the period of time during which it is possible to gamble without interruption is maybe maximum 5min x 12 = 60 min = 1 hour.
Score: 5
5. Chance of winning a profit
The probability of realizing a profit with each game is on average 33.33% and in many occasions
> 25%.
Score: 10
6. Availability
“Bet-for soccer” is accessed online. Gambling opportunities are generally at home or at the workplace.
Score: 10
7. Multiple playing-/stake opportunities
There are multiple playing opportunities (i.e., betting on some or all 12 matches) at the same time (per week) per player (gambler) and by using one userID. There exist multiple (= 12) stake opportunities as well.
Score: 10
8. Variable stake amount
The stake that gamblers can choose is variable. The stake amount is limited between $1 (minimum) and $100 per each match. In total – by betting on all 12 matches – between $12 and $1.200 per week.
Score: 5
9. Sensory product design
Visual effects exist. Auditory effects non-exist.
Score: 5
10. Near wins
A gambler could suppose an almost win (to miss the profit narrowly; a near win). But in this case it is unintentionally created by the supplier/producer. It occurs by chance.
Score: 5
Multiplication of general weights with individual scales of the fictitious sport betting game bet-for-soccer:
|
Risk potential criteria |
weights (fix) |
score |
example[2] |
|
Event frequency |
8 |
0 |
0 |
|
Interval of payback |
6 |
10 |
60 |
|
Jackpot |
5 |
0 |
0 |
|
Continuity of playing |
8 |
5 |
40 |
|
Chance of winning a profit |
6 |
10 |
60 |
|
Availability |
7 |
10 |
70 |
|
Multiple playing-/stake opportunities |
6 |
10 |
60 |
|
Variable stake amount |
6 |
5 |
30 |
|
Sensory product design |
4 |
5 |
20 |
|
Near wins |
6 |
5 |
30 |
|
Totals |
62 |
- |
370 |
In Figure 1 the corresponding radar chart is shown. It illustrates the dimension and form of the expanse within the graphic product-profile. Amplitudes of certain dimensions become apparent.[3]
Figure 2 shows the structure of the responsibilities, which dimensions account for the risk potential of addiction in that specific case, and which dimensions do not appear to contribute to this risk potential. In this example it becomes apparent that in particular the dimensions “Interval of payback”, “Chance of winning a profit”, “Availability” as well as “Multiple playing and stake opportunities” seem to be important referring the risk potential for becoming addicted. On the other hand the “Event frequency” does not seem to initialize any risk potential at all.
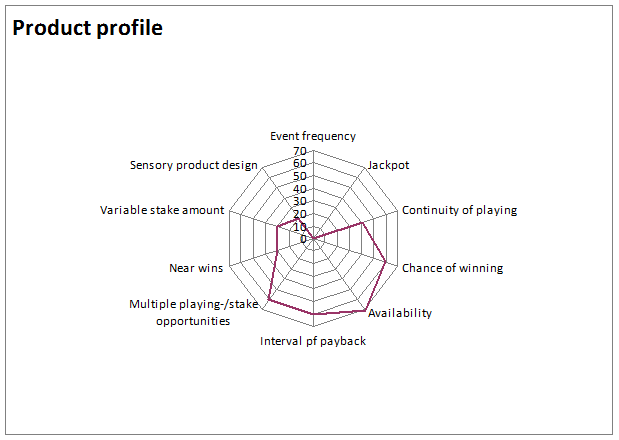
Figure 1: Radar chart showing the risk potential of the fictitious sport betting game
bet-for-soccer
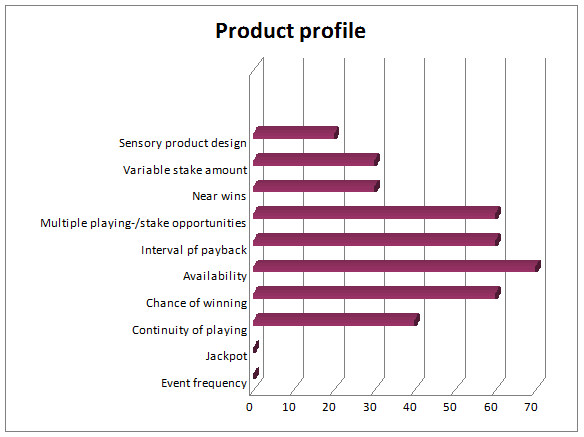
Figure 2: Bar chart showing the risk potential of the fictitious sport betting game
bet-for-soccer
To analyse the dimensions in greater detail and compare them with each other, it is useful to create a bar diagram in addition to the spider chart (Figure 2).
In total, the risk potential for becoming addicted of the fictitious sport betting game bet-for-soccer is rated with a score of approximately 5.97.[4]
The risk potential for becoming addicted of the fictitious sport betting game bet-for-soccercan thus be classified as moderate in tendency to high.
[1] These points correspond to the arithmetic mean of the individual ratings awarded by the team of experts which would be involved to evaluate the risk potential of the gambling product bet-for-soccer, which is here fictitiously assumed.
[2] Weights multiply with the scale in the concrete case.
[3] In a radar or spider chart, the values of the individual categories are displayed along one axis starting at the center of the chart and ending on the outer ring. This clarifies the variations of certain criteria.
[4] Results from dividing the total score (370) by 62 as described in the chapter “methodology”.